Welcome to San Diego Blog | January 20, 2010
Sales Statistics Downtown San Diego Real Estate
When I meet with local property owners who are interested in selling their downtown San Diego real estate, a frequent topic of discussion that comes up is listing price versus sales price. Because this is one of the real estate statistics I cover on an almost daily basis, I decided it will become one of our ongoing monthly posts.
Our commitment to buyers and sellers of downtown San Diego property is to provide relevant information that will help them make sound investment decisions. The numbers provided below are for Dowtown San Diego’s 92101 zip code, but if you would like specific numbers for your downtown San Diego condo building or downtown San Diego Lofts, please contact us for a complete report.

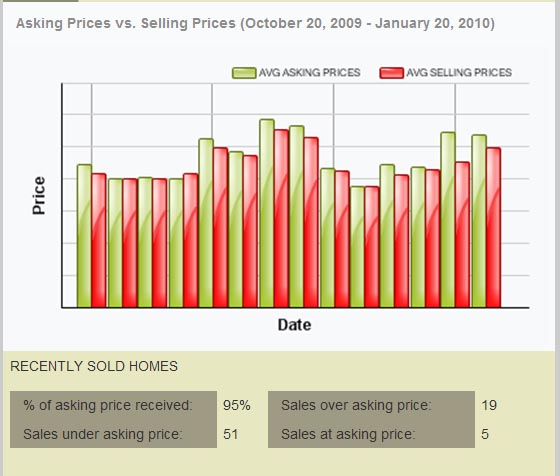
The above graph represents a 14 month period of Downtown San Diego Condos and Downtown San Diego Lofts asking price comparison to sales price. The numbers average to show that Downtown San Diego Home sellers are receiving on average 95% of the prices they are listing their homes for.
How does this affect you?
- Questions you should be asking your real estate agent are:
- What percentage of list price are you acheiving for your sellers?
- What is the average days on Market for homes you sell?
- What are you going to do to market my home and get the most exposure for my condo downtown San Diego?
In case you are wondering, our average list price to sales price is over 100%! Yes, we are able to creat enough excitement and exposure that we often sell our clients homes for at or above list price. If you would like information and statistics about your home, just let us know and we will do the research. Follow us on Facebook!