Welcome to San Diego Blog | June 30, 2022
Values Will NOT Plunge
No Crash Around the Corner
Housing data illustrates that there is not a housing crash on the horizon.
According to researchers at Penn State University, only 8% of the things that people worry about come true. From finances to job security to relationships to health, worry is everywhere. The collective mind seems to almost always jump to the worst-case scenario. It seems as if nobody is immune to worry.
With strong inflation numbers, Wall Street volatility, and soaring interest rates, panic and worry are in the air. So many are jumping to the immediate conclusion that as housing slows, values will eventually plunge as they did during the Great Recession. They recall how home values surged from 2000 to 2006, only to plummet after the subprime meltdown in March 2007. Everyone remembers the deep scars of the worst recession since the Great Depression.
Even though so many are anticipating and reporting that a housing crash is imminent, it simply is not going to occur, not now and not in the foreseeable future. Why not? Collectively, homeowners across the country were sitting in a much different position prior to the Great Recession compared to where they stand today. To best understand the differences let us take a closer look and compare the two.
First, the direction of housing has everything to do with supply and demand. Prior to the Great Recession, the inventory climbed to over five times where it stands today. There was a glut of homes on the market. Like today, demand was muted, but was due to the deterioration of lending standards. When low demand was pit against a glut of available homes, the market lined up heavily in favor of buyers and prices sank. Back then there were low or no down payments, fraudulent lending practices, and loose lending standards and programs, allowing anyone to get a loan and purchase a home.
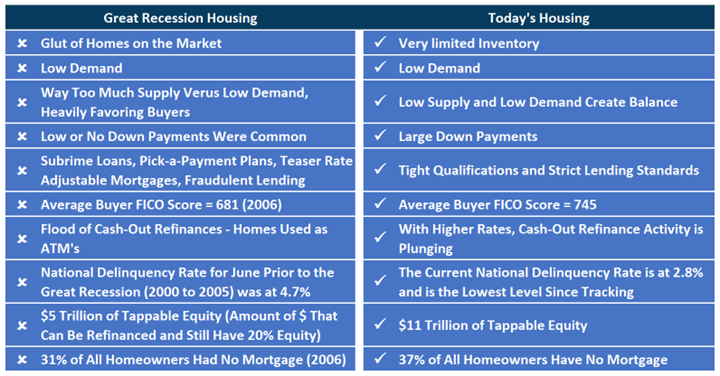
The average buyer’s FICO score was 681. Today, buyers are purchasing with higher down payments, tight qualifications, and lending standards, and the average FICO score for buyers is 745. Cash-out refinances accumulated for years leading up to the Great Recession. Yet, today, pulling cash out has been plunging as rates have climbed. There is plenty of tappable equity and there are far more homeowners who own their homes free and clear.
In 2007, homeowners were upside down, owing more than their homes were worth. Banks were in control of the housing market as there was a wave of foreclosures and short sales that lasted years because of enduring poor lending standards. Today, the delinquency rate is at its lowest level since tracking, much lower than the average from 2000 to 2005.
Looking at now versus then side by side it is easy to understand why the two time periods are completely different. Since the Great Recession, home buyers have been stronger. With the vast majority of homes sold over the last couple of years procuring multiple offers, Darwinism has taken place, survival of the fittest. Only the strongest buyers have been winning: strong credit, money in the bank, and good jobs.
It will be impossible to build an inventory that resembles the glut of homes available from 2006 through 2011. Today’s 4,140 home level is 79% less than the height reached in 2007 of nearly 20,000 homes. The inventory right now in San Diego County is 39% less than the 3-year average of 6,823 between 2017 and 2019 when things were normal prior to COVID. And, back then, home values were methodically climbing each year.
Yes, supply is rising. Demand is muted. The housing market is slowing. The number of offers received is dropping. The number of offers over the asking price is falling. Sales are down. The number of price reductions has been steadily climbing. The pace of housing, the Expected Market Time (the amount of time between hammering in the FOR-SALE sign to opening escrow) has slipped from an Insane Seller’s Market (less than 40 days) in March when it was at 18 days to a Hot Seller’s Market (between 40 and 60 days) today at 56 days. It is about to slip into a Slight Seller’s Market (from 60 to 90 days). Later this year it will decelerate to a Balanced Market (between 90 and 120 days), a market that does not favor buyers or sellers. And, if mortgage rates remain elevated above 5.5% with duration, it will most likely become a Slight Buyer’s Market (between 120 and 150 days) by year’s end. Yet, in 2007, the Expected Market Time surpassed 400 days in San Diego County, a Deep Buyer’s Market (over 150 days), when home values sank.
Even if housing were to slip into a Slight Buyer’s Market, it would have to be at those levels for months before prices start to decline. And any declines would be small. There is a real stickiness to home values. Very few sellers really “have to” sell. Homeowners are in a very strong position with plenty of equity, low mortgage rates, high credit scores, good jobs, and money in the bank. There will be no reason to panic. Values will not plunge.
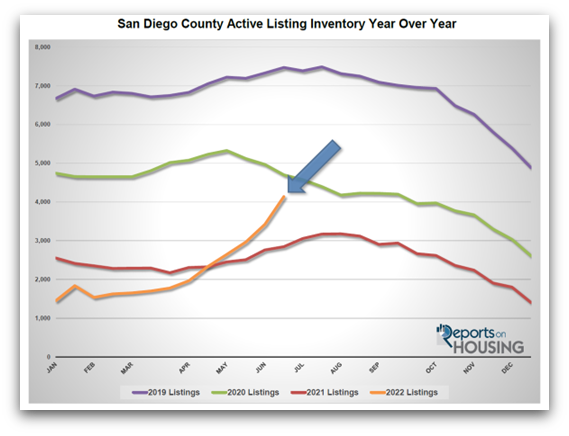
Active Listings
The current active inventory surged higher by 21%.
The active listing inventory soared higher, adding 717 homes in the past couple of weeks, up 21%, and now sits at 4,140, its highest level since September 2020. As demand continues to decline, the inventory rises have been gaining steam. It was the largest two-week rise since tracking began a decade ago. Warmer, longer days mean summer distractions are here. That is when demand falls due to all of summer’s extracurricular activities, vacations, and family time, and the inventory methodically rises until it peaks between mid-July and August. But, due to the shift in the market, many sellers will come on the market overpriced, expecting housing to behave as it did from July 2020 through March of this year. Instead, these overpriced properties will accumulate without success and will ultimately lead to a delayed peak between October and Thanksgiving. Price reductions are becoming more common with 31% of all available homes reducing their asking prices. This will continue to grow and gain steam over the coming months.
Last year, the inventory was at 2,847, 31% lower, or 1,293 fewer.
The new trend that developed this year is a sharp decrease in the number of homes coming on the market. For the month of May, there were 4,213 new FOR-SALE signs in San Diego County, 1,122 fewer than the 3-year average prior to COVID (2017 to 2019), 21% less. Missing signs counter the potential rise in the inventory.
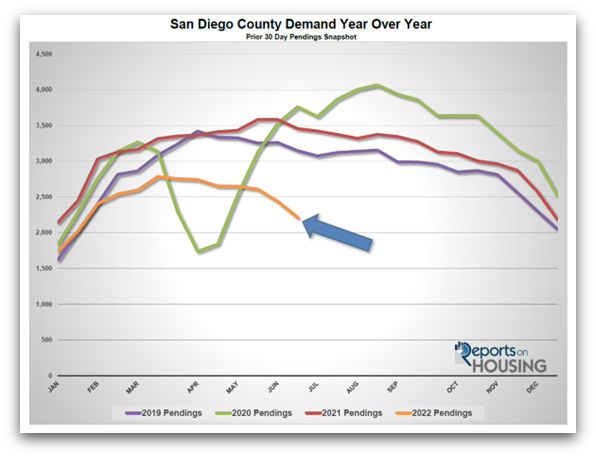
Demand
Demand dropped by 9% in the past couple of weeks.
Demand, a snapshot of the number of new escrows over the prior month, decreased from 2,441 to 2,216 in the past couple of weeks, plunging 9%, the largest drop of the year. It is at its lowest level for the end to June since tracking began in 2012. With the recent spike in mortgage rates a few weeks ago, the marketplace has been digesting this new higher rate environment; thus, the recent large drop in demand. From here, expect demand to continue to slowly fall throughout the summer months.
Last year, demand was at 3,458, 56% more than today, or an extra 1,242. The 3-year average prior to COVID (2017 to 2019) was at 3,382 pending sales, 53% more than today, or an extra 1,166.
With the supply surging higher and demand plunging, the Expected Market Time (the number of days to sell all San Diego County listings at the current buying pace) increased from 42 to 56 days in the past couple of weeks, its highest level since May 2020. At 56 days, it is a Hot Seller’s Market (less than 60 days) where sellers that are properly priced will procure plenty of showings, are able to call the shots during the negotiating process, will obtain multiple offers, and homes values will continue to rise (but not skyrocket). Last year the Expected Market Time was at 25 days, much faster than today. The 3-year average prior to COVID was at 61 days, slightly slower than today, and a Slight Seller’s Market (between 60 and 90 days).
Luxury End
The luxury market slowed considerably in the past couple of weeks.
In the past couple of weeks, the luxury inventory of homes priced above $1.5 million increased by 142 homes, up 17%, and now sits at 967, its highest level since October of 2020. Luxury demand plunged by 69 pending sales, down 18%, and now sits at 307. With inventory surging and demand plunging, the overall Expected Market Time for luxury homes priced above $1.5 million increased from 66 to 94 days, still a hot market for luxury, but cooling fast. The market time was at 35 days back in March, indicating that luxury is cooling just like the rest of the market. The volatility of Wall Street has had a significant impact on the luxury market.
Year over year, luxury demand is down by 61 pending sales or 17%, and the active luxury listing inventory is up by 269 homes or 39%. The Expected Market Time last year was at 57 days, considerably stronger than today.
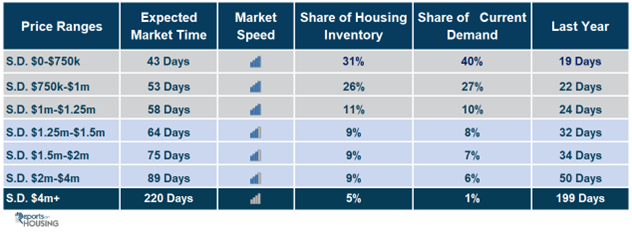
For homes priced between $1.5 million and $2 million, the Expected Market Time increased from 46 to 75 days. For homes priced between $2 million and $4 million, the Expected Market Time increased from 71 to 89 days. For homes priced above $4 million, the Expected Market Time increased from 152 to 220 days. At 220 days, a seller would be looking at placing their home into escrow around February 2023.
Copyright 2022 – Steven Thomas, Reports On Housing – All Rights Reserved. This report may not be reproduced in whole or part without express written permission by author.
Written by: Mia
Categories: Market Trends, Uncategorized